The Canterbury University Stratosphere
Troposphere Radar (CUSTAR) is a powerful atmospheric radar based at the
Birdlings Flat Field Site (near
CUSTAR is a clear air radar (radars of this class are also often called
wind profilers since they are most often used to measure the vertical and
horizontal wind speed) which means that it primarily observes clear air echoes
which are produced by fluctuations in the atmospheric radio refractive index. It
is important to note that these radar are also sensitive to Rayliegh scatter
from hydrometeors, but that the signal from this source is significantly smaller
than that from radio refractive index fluctuations at the operating frequency of
the radar (42.5MHz). The radio refractive index is a function of absolute
temperature, atmospheric pressure and the partial pressure of water vapour and
while the variations of atmospheric temperature, pressure and humidity only give
rise to variations of refractive index with magnitudes of the order of <10-6,
these are sufficient to cause detectable radar signals to be observed up to 14
km.
In general these small perturbations in the radio refractive index are
produced by turbulence caused by dynamic and convective instabilities. Turbulent mixing across a region
gives rise to refractive index gradients across a wide range of scale sizes
which produce returned signals. Fresnel reflection also occurs from
sharp vertical changes in the refractive index which are horizontally coherent
over a large spatial scale (the first Fresnel zone). Theoretical analysis of
both these return mechanisms indicates that the returned signal power observed
is directly related to the vertical gradient of the radio refractive index. Thus
examination of the returned signal allows us to determine
information about humidity
information about temperature
information about clear air turbulence and other
scattering mechanisms
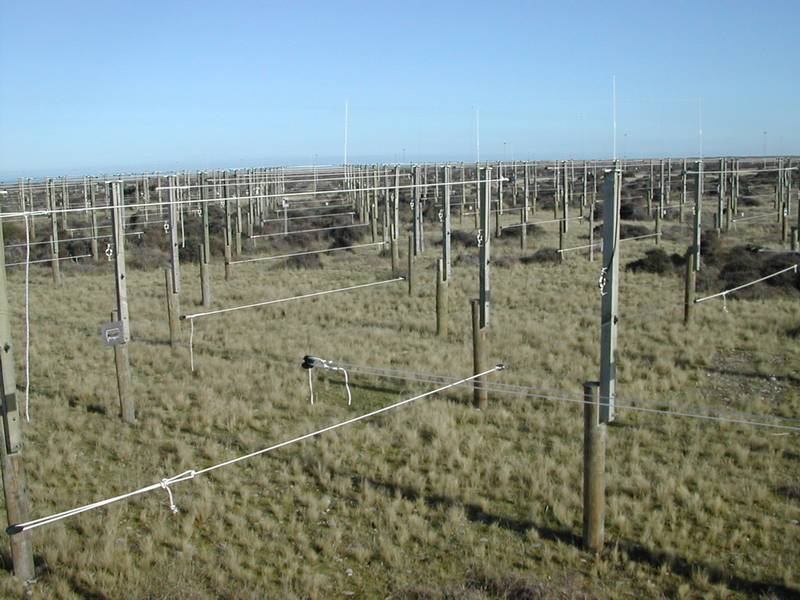
The first phase of the development of the CUSTAR system
has now been completed and a single near-vertically directed antenna has been in
continuous operation since August 2002. This radar operates at 42.5MHz and has a
large antenna formed from an array of dipoles (Figure 1), the area of the array
being approximately 3000m2 (7.5l
by 7.5 l).
The transmitter utilized produces pulses with a peak transmitted power of 100kW
and can produce pulses with a maximum duty cycle of 1.4% with a pulse repetition
frequency of nearly 2000Hz.. The returned signals are at present processed using
a simple Doppler spectral processing scheme. The first three moments of the
derived Doppler spectra allow the returned signal power, Doppler shift and
spectral width to be derived. The spectra can also be examined to determine the
noise level and the signal to noise ratio of the returns. It should be noted
that at this stage in the radars development because only the returns from a
single vertically pointed beam are measured only vertical signal power and
vertical velocity measurements can be examined.
The antenna array has been designed to maximize gain and directivity
while minimizing sidelobes and the overall cost. To achieve these aims, in the
diagonal direction, the dipoles are spaced by 0.707l,
and in the N-S and E-W directions the rows are spaced by half a wavelength.
Thus, when looking either North-South or East-West the power polar diagram is
that of a half-wavelength spaced array (with no ground lobe) and when looking
along either diagonal the pattern is that of a 0.707l
array. The theoretical antenna power polar diagrams for the array along the
North-South axis, the NW-SE axis and the NE-SW axis shows that the ground lobe
is more than 20dB below the value at the mainlobe. To ensure that the
theoretical polar diagram and the antennas actual polar diagram are consistent
reverse radio astronomy has been used. Reverse radio astronomy usually uses a
reference sky temperature map to determine radar reflectivity calibrations and
allow system performance monitoring. However, the presence of strong radio stars
and the galactic centre can also be used to verify the beam diagram, beam width
and beam pointing direction of the antenna array.
Several developments are to be made in the near future which will allow horizontal wind speed to be determined. A set of five (possibly six) extra spaced array antennas are to be built, the area of each of these antennas being 3l by 3l. The returns from each of these antennas will be received by a new receiver design. This design will reduce the saturation effect observed at low altitudes at present so that measurements can be made to 1km. The inphase and quadrature components from each of the six receivers is then passed to a new state-of-the-art data acquisition system which can sample the twelve channels simultaneously at a rate greater than one million samples per second. It should be noted that the throughput of this system is expected to be in the region of several GigaBytes per hour and thus data reduction and signal processing schemes will be of great importance. By examining the returns from each of these antenna using a scheme known as Full Correlation Analysis the horizontal wind speed can be determined. Full Correlation Analysis estimates the atmospheric wind velocity from the ground diffraction pattern resulting from the backscatter of a transmitted signal by atmospheric refractive index irregularities. The analysis assumes that contours of equal spatiotemporal correlation of the ground diffraction pattern can be approximated by a family of ellipsoids. The pattern is then generally sampled at three antennas, and the magnitudes of the temporal autocorrelation function and cross correlation functions calculated from the complex signals recorded at the antennas are used to parameterize the spatiotemporal correlation function and thereby the wind speed.
The first results from the radar are in the process of being examined. Initial results produced by Trevor Carey Smith can be found here.
A PDF version of a poster describing some initials results from the CUSTAR system which was presented at the 2002 Conference of The Meteorological Society of New Zeland can be found here.