Alpha Centauri Project
Home |
α Centauri System |
Spectrum |
Hercules |
Team Members
Sample spectrum of α Cen A + iodine cell spectrum: 2009 Jan 22
All our spectra are being recorded by first passing the light through an iodine cell containg iodine vapour at 50.0 C. This imprints thousands of fine iodine absorption lines onto the stellar spectrum. The iodine lines serve as a zero-velocity reference against which precise radial velocities of either star can be measured.

The image shows a typical alpha cen A spectrum, recorded 22 Jan 2009. The white horizontal strips are the echelle orders, each order corresponding to starlight of a slightly different wavelength or colour. The colours used are from green (bottom strips) to red (at the top of the image). The dark lines along each order are the absorption lines, and those most clearly visible are mainly from the star. However, thousands of weak lines correspond to iodine in the cell, but these are barely visible at this resolution.
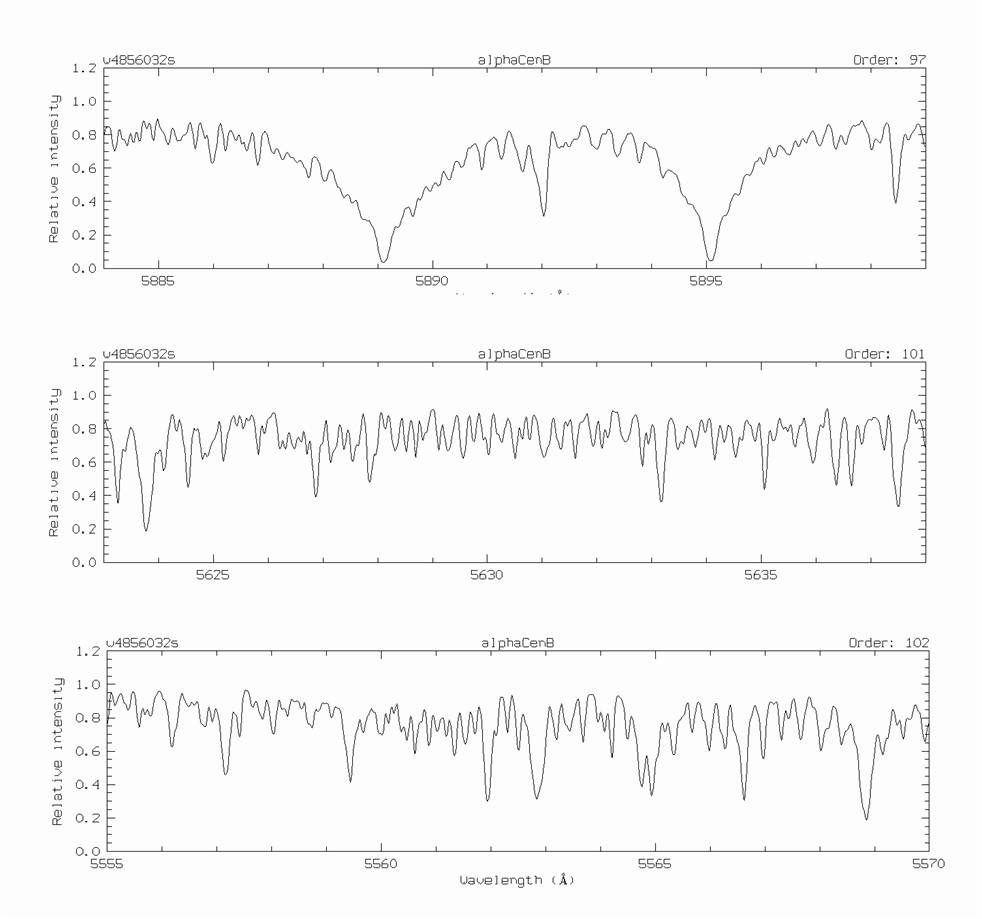
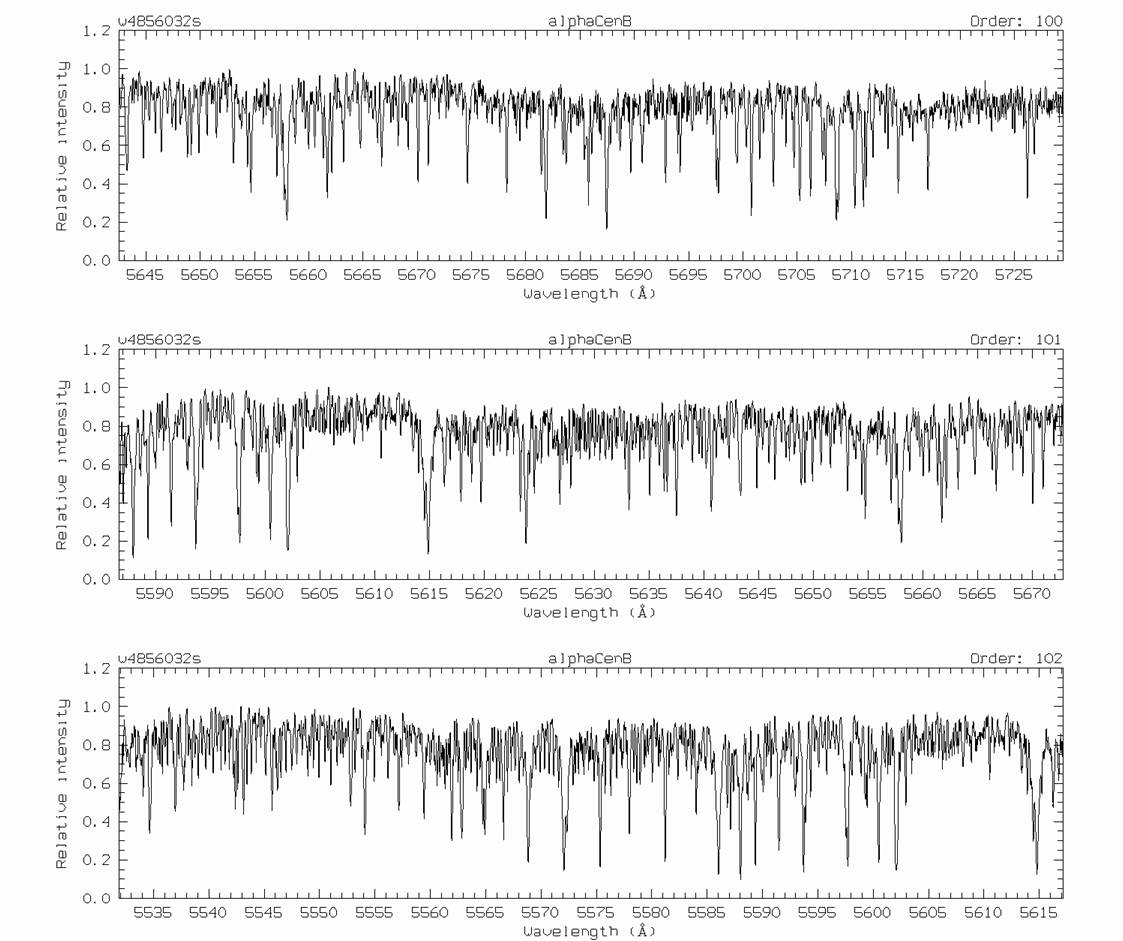
The spectrum below shows the observation of three echelle orders of alpha Cen B, after plotting the flux against wavelength. Now the numerous weak iodine lines are clearly visible.

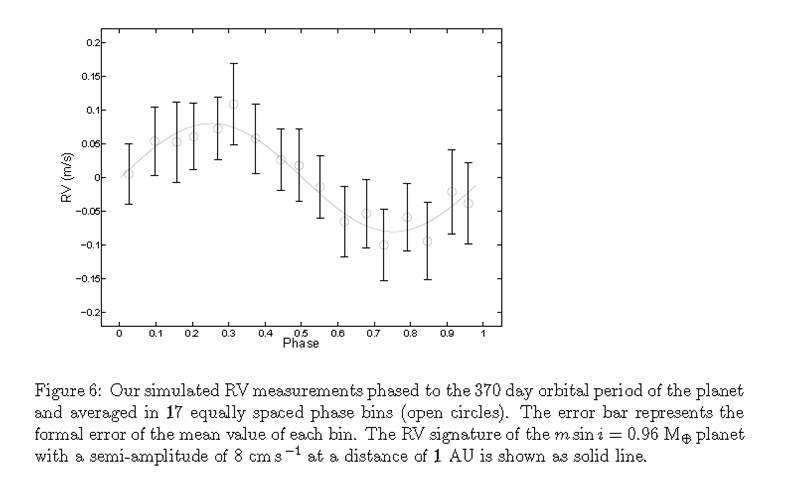
RV simulation on α Cen A to find a one Earth-mass planet at 1 A.U.
Dr Michael Endl
has carried out a radial velocity simulation on alpha centauri A using real Mt John Hercules data.
The simulation assumed 11,500 spectra per year each with σ = 3 m/s. The planet induces a signal with K = 8 cm/s, P = 370 d. The power spectrum shows this planet is easily detectable, even after 2 years!
The data used were 963 actual Hercules data recorded April 2009, which were used to generate 46000 simulated observations over 4 years.

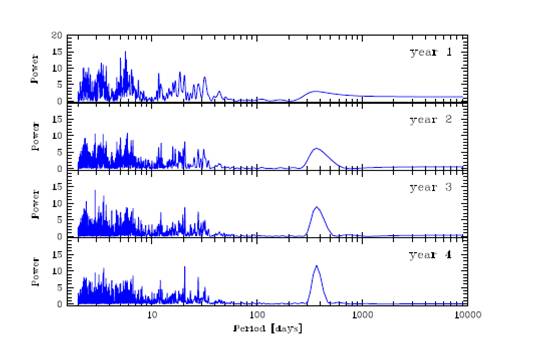
The results of the simulation show a periodogram analysis of the periodicity of any radial velocity variations. The artificially induced signal at period one year is visible in the data after two years, and increasingly visible after three and four years.
The multiple peaks on the left are the result of high frequency noise in the data.