DEMONSTRATION
Nature does not readily admit demonstrations of the gravitational lensing of stars by stars, because the angles involved are generally too small to be resolved. The radius of the Einstein ring depicted on Gravitational Microlensing is typically about one milli-arcsec, or about 100x smaller than the diffraction limit of the best telescopes. This permits the integrated light of the entire image to be recorded only.
A demonstration of the lensing effect may, however, be readily set up using plastic lenses to mimic the gravitational field. This has been done below.
|
|
Two perspex lenses were milled to yield deflection proportional to 1/b where b denotes impact parameter from the centre. Using Einstein's formula for the gravitational deflection by mass M, deflection = 4GM/c2b, the effective masses of the lenses were 0.28x and 0.056x the mass of the Earth. The diameters of both lenses were 24cm. Their profiles were calculated following Sidney Liebes, American Journal of Physics vol. 37, pages 103-104 (1969). |
|
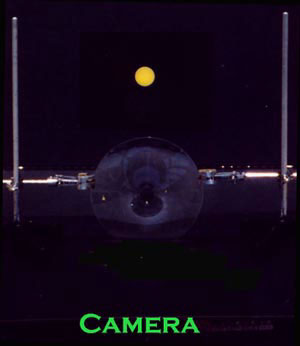
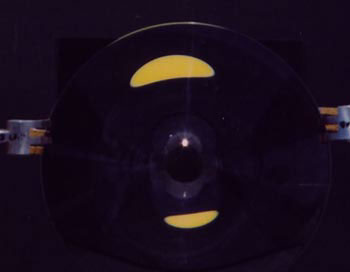
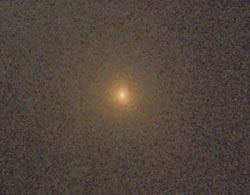
Simulated stars were photographed through the lenses, where stars were represented by circles of various colours printed on black background. Figure1a and Figure1b show the setup, and Figure1c shows an image of a star seen through the heavier lens. Figure2a and figure2b show the lenses used in the demonstration. |
|
|
|
Figure3 simulates a moving star, and Figure3a and Figure3b the running images when a source moves exactly behind a lens, or, as is usually the case, only approximately behind a lens. Figure3c shows images produced by the lighter lens. |
As an aid to the interpretation of data on microlensing events, "magnification maps" are often used. These are images of a point source of light produced by gravitational lenses (Figure4)
|
Figure4a shows the image produced by a single gravitational lens. Since light rays are reversible, it also respresent the "magnification map" of the lens. Place a star at any position on the magnification map, and the intensity of the map at that position gives the brightness of the star as seen by a telescope located at the point source. As a star moves in the sky along a straight trajectory, the brightness first rises and then declines, following the Liebes-Paczynski light curve shown on Microlensing Alerts. |
|
|
|
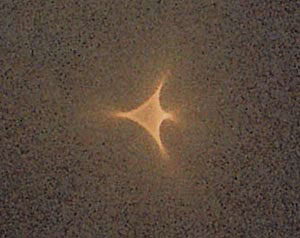
Figure5a, Figure5b, Figure5c and Figure5d show the magnification maps produced by binary lenses with increasing distances between the lenses. These exhibit the famous "caustics" or lines of infinite magnification. A real example of a caustic appears on Stellar Atmospheres. |
Finally, videos were shot of moving stars (Movie Setup).
Movie1 (2MB) and Movie2 (1MB) show images produced by a single lens, and Movie3 (0.5MB) the image produced by a binary lens, where the secondary lens is on the path of one of the images of the primary lens.
[Credits: Lenses - David Cochrane, IRL Ltd, Wellington;
Photography, Kevin Taylor and Philip Yock, University of Auckland;
File Compression, Amstore Ltd, Auckland.]


